
Retail Comps made simple
Compare trade areas by drive time or radius and validate market potential in minutes.
Used by modern retail operators, developers, and brokerage teams
“We built defendable comps in minutes. The side‑by‑side made the decision obvious.” — [Name], [Title], [Company]
The old way
- Manual maps and copy‑pasted lists
- Unclear trade‑area boundaries and apples‑to‑oranges comps
- Slow, opinion‑driven go/no‑go
With reSpots Retail Comps
- Side‑by‑side trade‑area comparisons in 30–60 seconds
- Drive‑time and radius that match your business rules
- Plain‑language callouts, not just charts
Key features
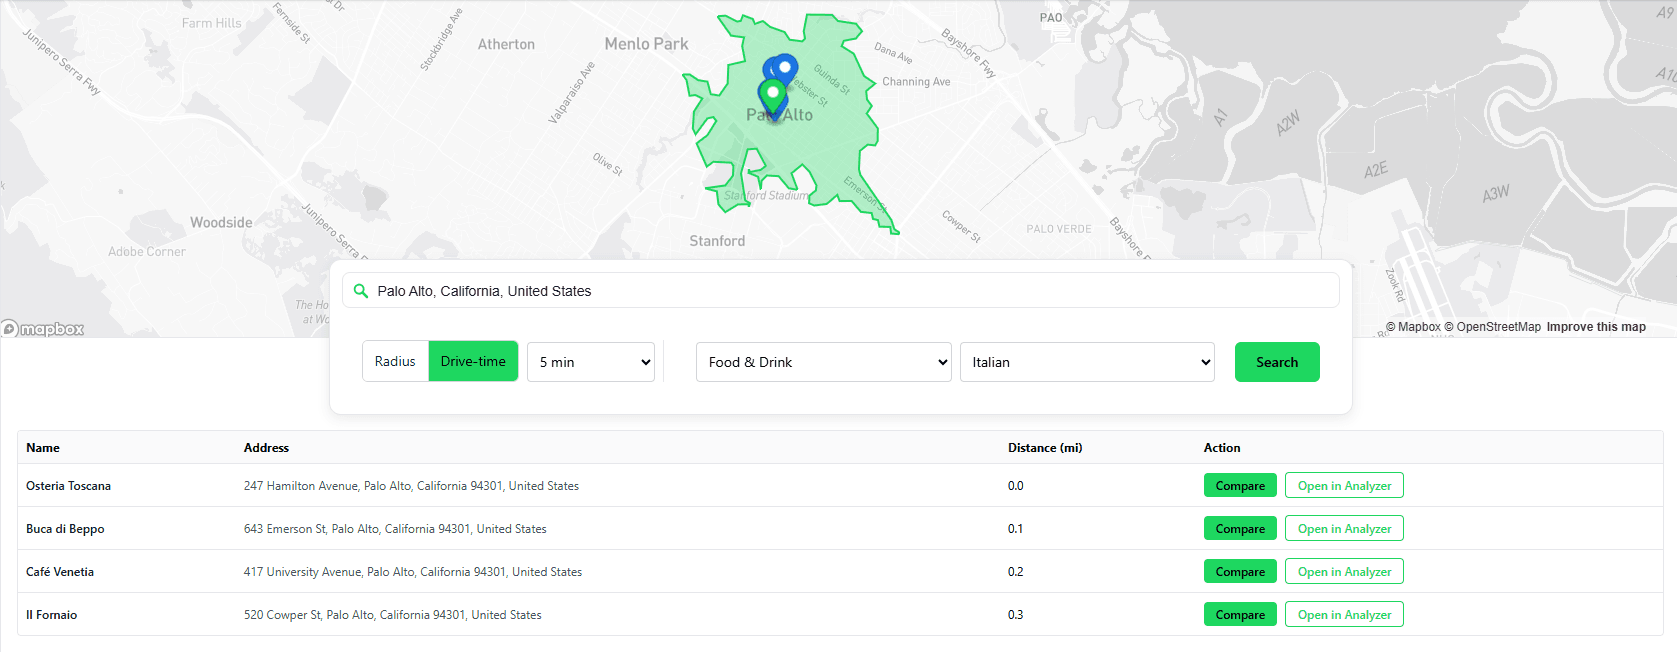
Distance modes: radius and drive time
Define a fixed radius or an isochrone (drive time). One mode at a time keeps results consistent. Toggle values to stress‑test the catchment.
- Mode options: Radius, Drive‑time
- One active mode at a time
- Fast re‑runs to compare scenarios
Demographics coverage
Essential trade‑area metrics for retail decisions.
- Population
- Median and mean household income
- Median rent and home value
- Occupancy and vacancy
- Age distribution
POI proximity (competition and convenience)
Select by parent category and subcategory. View nearby retail POIs with distance context. No ratings, reviews, or hours.
- Parent category + subcategory filters
- Distance context (miles/minutes)
- Focus on competitive mix and adjacency
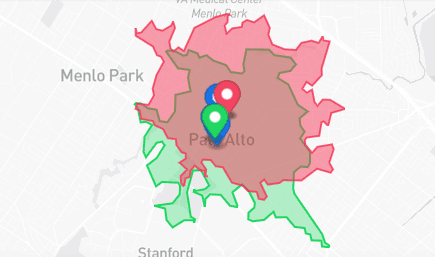
Side‑by‑side comparisons
Compare primary vs secondary (optionally a third) using the same mode and value. Simple deltas show which side wins.
- Consistent geometry on both sides
- Plain‑language deltas
- Decision‑ready outputs
Example outputs
Use cases
QSR / Fast Casual
Validate convenience, income bands, and adjacency to food traffic generators before committing to a site.
Fitness
Check catchment population and age distribution; verify adjacency to complementary services.
Grocery
Confirm household counts, income thresholds, and competitor proximity.
Pharmacy
Ensure coverage and convenience vs. incumbents; verify nearby daily‑needs anchors.
How it works
- 1) Search
Enter the subject address, pick a mode (radius or drive) and a value. Set parent category + subcategory.
- 2) Compare
Review the POI list, then Compare a few candidates to open the side‑by‑side demographics panel.
- 3) Decide
Scan deltas and make a go/no‑go. Re‑run with a new radius or drive‑time to confirm.
Time to answer: 30–60 seconds to a defendable snapshot.
FAQs
What data is included?
Can I compare multiple locations?
Do you include ratings, reviews, or hours?
Do you show saturation/whitespace maps?
Can I export results?
Who is this for?
Pick better retail sites—without the noise
Run retail comps by drive time or radius and decide with confidence.